The 2x2 Matrix. Contingency, Confusion, and the Metrics of Binary Classification
Book information
Description
This book presents and discusses the numerous measures of test performance that can be derived from 2x2 tables. Worked examples based on pragmatic test accuracy study data are used in chapters to illustrate relevance to day-to-day clinical practice. Readers will gain a good understanding of sensitivity and specificity and predictive values along with many other parameters. The contents are highly structured and the use of worked examples facilitates understanding and interpretation. This book is a resource for clinicians in any discipline who are involved in the performance or assessment of test accuracy studies, and professionals in the disciplines of machine learning or informatics wishing to gain insight into clinical applications of 2x2 tables. Preface Acknowledgements Contents Chapter 1: Introduction 1.1 History and Nomenclature 1.2 The Fourfold (2 × 2) Contingency Table 1.3 Marginal Totals and Marginal Probabilities 1.3.1 Marginal Totals 1.3.2 Marginal Probabilities; P, Q 1.3.3 Pre-test Odds 1.4 Type I (α) and Type II (β) Errors 1.5 Calibration: Decision Thresholds or Cut-Offs 1.6 Uncertain or Inconclusive Test Results 1.7 Measures Derived from a 2 × 2 Contingency Table; Confidence Intervals References Chapter 2: Paired Measures 2.1 Introduction 2.2 Error-Based Measures 2.2.1 Sensitivity (Sens) and Specificity (Spec), or True Positive and True Negative Rates (TPR, TNR) 2.2.2 Quality Measures (QSN, QSP) 2.2.3 False Positive Rate (FPR), False Negative Rate (FNR) 2.3 Information-Based Measures 2.3.1 Positive and Negative Predictive Values (PPV, NPV) 2.3.2 Bayes’ Formula; Standardized Positive and Negative Predictive Values (SPPV, SNPV) 2.3.3 False Discovery Rate (FDR), False Reassurance Rate (FRR) 2.3.4 Positive and Negative Likelihood Ratios (LR+, LR−) 2.3.5 Post-test Odds; Net Harm to Net Benefit (H/B) Ratio 2.3.6 Conditional Probability Plot 2.3.7 Positive and Negative Predictive Ratios (PPR, NPR) 2.4 Association-Based Measures 2.4.1 Diagnostic Odds Ratio (DOR) and Error Odds Ratio (EOR) 2.4.2 Clinical Utility Index (CUI+, CUI−) and Clinical Disutility Index (CDI+, CDI−) References Chapter 3: Paired Complementary Measures 3.1 Introduction 3.2 Error-Based Measures 3.2.1 Sensitivity (Sens) and False Negative Rate (FNR) 3.2.2 Specificity (Spec) and False Positive Rate (FPR) 3.2.3 “SnNout” and “SpPin” Rules 3.2.4 Accuracy and Inaccuracy 3.2.5 Classification and Misclassification Rates; Misclassification Costs 3.3 Information-Based Measures 3.3.1 Positive Predictive Value (PPV) and False Discovery Rate (FDR) 3.3.2 Negative Predictive Value (NPV) and False Reassurance Rate (FRR) 3.4 Dependence of Paired Complementary Measures on Prevalence (P) References Chapter 4: Unitary Measures 4.1 Introduction 4.2 Youden Index (Y) or Statistic (J) 4.3 Predictive Summary Index (PSI, Ψ) 4.4 Harmonic Mean of Y and PSI (HMYPSI) 4.5 Matthews’ Correlation Coefficient (MCC) 4.6 Identification Index (II) 4.7 Net Reclassification Improvement (NRI) 4.8 Critical Success Index (CSI) or Threat Score (TS) 4.9 F Measure (F) or F1 Score (Dice Coefficient) 4.10 Summary Utility Index (SUI) and Summary Disutility Index (SDI) References Chapter 5: Reciprocal Measures 5.1 Introduction 5.2 Number Needed to Diagnose (NND) 5.3 Number Needed to Predict (NNP) 5.4 Number Needed to Misdiagnose (NNM) 5.5 Likelihood to Be Diagnosed or Misdiagnosed (LDM) 5.6 Number Needed to Screen (NNS) 5.7 Number Needed for Screening Utility (NNSU) and Number Needed for Screening Disutility (NNSD) References Chapter 6: Measures Not Directly Related to the 2 × 2 Contingency Table 6.1 Introduction 6.2 Receiver Operating Characteristic (ROC) Plot or Curve 6.2.1 Defining Optimal Cut-Off: Youden Index (Y) 6.2.2 Defining Optimal Cut-Off: Euclidean Index (d) 6.2.3 Defining Optimal Cut-Off: Q* Index 6.2.4 Defining Optimal Cut-Off: Other ROC-Based Methods 6.2.5 Defining Optimal Cut-Off: Diagnostic Odds Ratio (DOR) 6.2.6 Defining Optimal Cut-Off: Non-ROC-Based Methods 6.3 Other Graphing Methods 6.3.1 ROC Plot in Likelihood Ratio Coordinates 6.3.2 Precision-Recall (PR) Plot or Curve 6.3.3 Prevalence Value Accuracy Plots 6.3.4 Agreement Charts 6.4 Effect Sizes 6.4.1 Correlation Coefficient 6.4.2 Cohen’s d 6.4.3 Binomial Effect Size Display (BESD) References Chapter 7: Other Measures, Other Tables 7.1 Introduction 7.2 Other measures 7.2.1 Measure of Association: McNemar’s Test 7.2.2 Measure of Agreement: Cohen’s Kappa (κ) Statistic 7.2.3 Limits of Agreement: Bland-Altman Method 7.3 Other Tables 7.3.1 Higher Order Tables 7.3.2 Interval Likelihood Ratios (ILRs) 7.3.3 Three-Way Classification (Trichotomisation) 7.3.4 Combining Test Results 7.3.5 Decision Trees; Machine Learning 7.3.6 Fourfold Pattern of Risk Attitudes 7.3.7 Epistemological Matrix 7.4 Conclusion: Which Measure(s) Should Be Used? References Index
Similar books
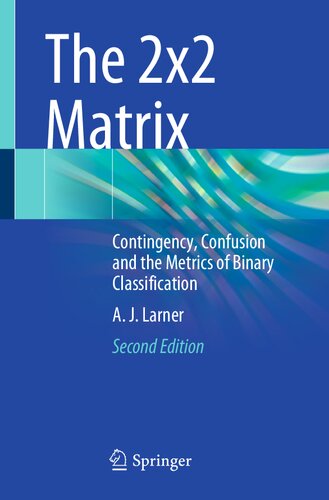
The 2x2 Matrix: Contingency, Confusion and the Metrics of Binary Classification
2024 · PDF

Manual of Screeners for Dementia: Pragmatic Test Accuracy Studies
2020 · EPUB

Diagnostic Test Accuracy Studies in Dementia: A Pragmatic Approach
2019 · PDF

Dementia in Clinical Practice: A Neurological Perspective
2018 · PDF

Neuropsychological Neurology: The Neurocognitive Impairments of Neurological Disorders
2008 · PDF

MySQL® Notes for Professionals book
2018 · PDF

MrExcel 2022: Boosting Excel
2022 · PDF

MrExcel 2022: Boosting Excel
2022 · PDF