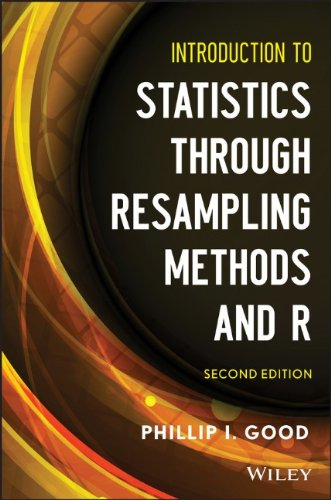
Introduction to Statistics Through Resampling Methods and R
Book information
Description
Written in a highly accessible style, Introduction to Statistics through Resampling Methods and R, Second Edition guides students in the understanding of descriptive statistics, estimation, hypothesis testing, and model building. The book emphasizes the discovery method, enabling readers to ascertain solutions on their own rather than simply copy answers or apply a formula by rote. The Second Edition utilizes the R programming language to simplify tedious computations, illustrate new concepts, and assist readers in completing exercises. The text facilitates quick learning through the use of: More than 250 exercises—with selected "hints"—scattered throughout to stimulate readers' thinking and to actively engage them in applying their newfound skills An increased focus on why a method is introduced Multiple explanations of basic concepts Real-life applications in a variety of disciplines Dozens of thought-provoking, problem-solving questions in the final chapter to assist readers in applying statistics to real-life applications Introduction to Statistics through Resampling Methods and R, Second Edition is an excellent resource for students and practitioners in the fields of agriculture, astrophysics, bacteriology, biology, botany, business, climatology, clinical trials, economics, education, epidemiology, genetics, geology, growth processes, hospital administration, law, manufacturing, marketing, medicine, mycology, physics, political science, psychology, social welfare, sports, and toxicology who want to master and learn to apply statistical methods. Cover Title Page Copyright Page Table of Contents Preface 1. Variation 1.1 Variation 1.2 Collecting Data 1.2.1 A Worked-Through Example 1.3 Summarizing Your Data 1.3.1 Learning to Use R 1.4 Reporting Your Results 1.4.1 Picturing Data 1.4.2 Better Graphics 1.5 Types of Data 1.5.1 Depicting Categorical Data 1.6 Displaying Multiple Variables 1.6.1 Entering Multiple Variables 1.6.2 From Observations to Questions 1.7 Measures of Location 1.7.1 Which Measure of Location? 1.7.2 The Geometric Mean 1.7.3 Estimating Precision 1.7.4 Estimating with the Bootstrap 1.8 Samples and Populations 1.8.1 Drawing a Random Sample 1.8.2 Using Data That Are Already in Spreadsheet Form 1.8.3 Ensuring the Sample Is Representative 1.9 Summary and Review 2. Probability 2.1 Probability 2.1.1 Events and Outcomes 2.1.2 Venn Diagrams 2.2 Binomial Trials 2.2.1 Permutations and Rearrangements 2.2.2 Programming Your Own Functions in R 2.2.3 Back to the Binomial 2.2.4 The Problem Jury 2.3 Conditional Probability 2.3.1 Market Basket Analysis 2.3.2 Negative Results 2.4 Independence 2.5 Applications to Genetics 2.6 Summary and Review 3. Two Naturally Occurring Probability Distributions 3.1 Distribution of Values 3.1.1 Cumulative Distribution Function 3.1.2 Empirical Distribution Function 3.2 Discrete Distributions 3.3 The Binomial Distribution 3.3.1 Expected Number of Successes in n Binomial Trials 3.3.2 Properties of the Binomial 3.4 Measuring Population Dispersion and Sample Precision 3.5 Poisson:Events Rare in Time and Space 3.5.1 Applying the Poisson 3.5.2 Comparing Empirical and Theoretical Poisson Distributions 3.5.3 Comparing Two Poisson Processes 3.6 Continuous Distributions 3.6.1 The Exponential Distribution 3.7 Summary and Review 4. Estimation and the Normal Distribution 4.1 Point Estimates 4.2 Properties of the Normal Distribution 4.2.1 Student’s t-Distribution 4.2.2 Mixtures of Normal Distributions 4.3 Using Confidence Intervals to Test Hypotheses 4.3.1 Should We Have Used the Bootstrap? 4.3.2 The Bias-Corrected and Accelerated Nonparametric Bootstrap 4.3.3 The Parametric Bootstrap 4.4 Properties of Independent Observations 4.5 Summary and Review 5. Testing Hypotheses 5.1 Testing a Hypothesis 5.1.1 Analyzing the Experiment 5.1.2 Two Types of Errors 5.2 Estimating Effect Size 5.2.1 Effect Size and Correlation 5.2.2 Using Confidence Intervals to Test Hypotheses 5.3 Applying the t-Test to Measurements 5.3.1 Two-Sample Comparison 5.3.2 Paired t-Test 5.4 Comparing Two Samples 5.4.1 What Should We Measure? 5.4.2 Permutation Monte Carlo 5.4.3 One-vs.Two-Sided Tests 5.4.4 Bias-Corrected Nonparametric Bootstrap 5.5 Which Test Should We Use? 5.5.1 p-Values and Significance Levels 5.5.2 Test Assumptions 5.5.3 Robustness 5.5.4 Power of a Test Procedure 5.6 Summary and Review 6. Designing an Experiment or Survey 6.1 The Hawthorne Effect 6.1.1 Crafting an Experiment 6.2 Designing an Experiment or Survey 6.2.1 Objectives 6.2.2 Sample from the Right Population 6.2.3 Coping with Variation 6.2.4 Matched Pairs 6.2.5 The Experimental Unit 6.2.6 Formulate Your Hypotheses 6.2.7 What Are You Going to Measure? 6.2.8 Random Representative Samples 6.2.9 Treatment Allocation 6.2.10 Choosing a Random Sample 6.2.11 Ensuring Your Observations Are Independent 6.3 How Large a Sample? 6.3.1 Samples of Fixed Size 6.3.1.1 Known Distribution 6.3.1.2 Almost Normal Data 6.3.1.3 Bootstrap 6.3.2 Sequential Sampling 6.3.2.1 Stein’s Two-Stage Sampling Procedure 6.3.2.2 Wald Sequential Sampling 6.3.2.3 Adaptive Sampling 7.3.4 Data from Minitab,SAS,SPSS,or Stata Data Files 9.1.1 Why Build Models? 6.4 Meta-Analysis 6.5 Summary and Review 7. Guide to Entering,Editing,Saving,and Retrieving Large Quantities of Data Using R 7.1 Creating and Editing a Data File 7.2 Storing and Retrieving Files from within R 7.3 Retrieving Data Created by Other Programs 7.3.1 The Tabular Format 7.3.2 Comma-Separated Values 7.3.3 Data from Microsoft Excel 7.4 Using R to Draw a Random Sample 8. Analyzing Complex Experiments 8.1 Changes Measured in Percentages 8.2 Comparing More Than Two Samples 8.2.1 Programming the Multi-Sample Comparison in R 8.2.2 Reusing Your R Functions 8.2.3 What Is the Alternative? 8.2.4 Testing for a Dose Response or Other Ordered Alternative 8.3 Equalizing Variability 8.4 Categorical Data 8.4.1 Making Decisions with R 8.4.2 One-Sided Fisher’s Exact Test 8.4.3 The Two-Sided Test 8.4.4 Testing for Goodness of Fit 8.4.5 Multinomial Tables 8.5 Multivariate Analysis 8.5.1 Manipulating Multivariate Data in R 8.5.2 Hotelling’s T2 8.5.3 Pesarin–Fisher Omnibus Statistic 8.6 R Programming Guidelines 8.7 Summary and Review 9. Developing Models 9.1 Models 9.1.2 Caveats 9.2 Classification and Regression Trees 9.2.1 Example:Consumer Survey 9.2.2 How Trees Are Grown 9.2.3 Incorporating Existing Knowledge 9.2.4 Prior Probabilities 9.2.5 Misclassification Costs 9.3 Regression 9.3.1 Linear Regression 9.4 Fitting a Regression Equation 9.4.1 Ordinary Least Squares 9.4.2 Types of Data 9.4.3 Least Absolute Deviation Regression 9.4.4 Errors-in-Variables Regression 9.4.5 Assumptions 9.5 Problems with Regression 9.5.1 Goodness of Fit versus Prediction 9.5.2 Which Model? 9.5.3 Measures of Predictive Success 9.5.4 Multivariable Regression 9.6 Quantile Regression 9.7 Validation 9.7.1 Independent Verification 9.7.2 Splitting the Sample 9.7.3 Cross-Validation with the Bootstrap 9.8 Summary and Review 10. Reporting Your Findings 10.1 What to Report 10.1.1 Study Objectives 10.1.2 Hypotheses 10.1.3 Power and Sample Size Calculations 10.1.4 Data Collection Methods 10.1.5 Clusters 10.1.6 Validation Methods 10.2 Text,Table,or Graph? 10.3 Summarizing Your Results 10.3.1 Center of the Distribution 10.3.2 Dispersion 10.3.3 Categorical Data 10.4 Reporting Analysis Results 10.4.1 p-Values? Or Confidence Intervals? 10.5 Exceptions Are the Real Story 10.5.1 Nonresponders 10.5.2 The Missing Holes 10.5.3 Missing Data 10.5.4 Recognize and Report Biases 10.6 Summary and Review 11. Problem Solving 11.1 The Problems 11.2 Solving Practical Problems 11.2.1 Provenance of the Data 11.2.2 Inspect the Data 11.2.3 Validate the Data Collection Methods 11.2.4 Formulate Hypotheses 11.2.5 Choosing a Statistical Methodology 11.2.6 Be Aware of What You Don’t Know 11.2.7 Qualify Your Conclusions Answers to Selected Exercises Index
Similar books

Resampling Methods: A Practical Guide to Data Analysis
2005 · PDF
Introduction to Statistics Through Resampling Methods and R
2013 · EPUB

Common Errors in Statistics
2009 · PDF

Common Errors in Statistics (And How to Avoid Them), Fourth Edition

Introduction to Statistics Through Resampling Methods and R
2013 · PDF
Applying Statistics in the Courtroom: A New Approach for Attorneys and Expert Witnesses
2001 · PDF

Analyzing the Large Number of Variables in Biomedical and Satellite Imagery
2011 · PDF

Permutation, Parametric, and Bootstrap Tests of Hypotheses (Springer Series in Statistics)
2004 · PDF