Exploratory Data Analysis with R
Book information
Description
Version: 2015-06-23 80% complete https://leanpub.com/exdata This book covers some of the basics of visualizing data in R and summarizing highdimensional data with statistical multivariate analysis techniques. There is less of an emphasis on formal statistical inference methods, as inference is typically not the focus of EDA. Rather, the goal is to show the data, summarize the evidence and identify interesting patterns while eliminating ideas that likely won’t pan out. Throughout the book, we will focus on the R statistical programming language. We will cover the various plotting systems in R and how to use them effectively. We will also discuss how to implement dimension reduction techniques like clustering and the singular value decomposition. All of these techniques will help you to visualize your data and to help you make key decisions in any data analysis.
Similar books
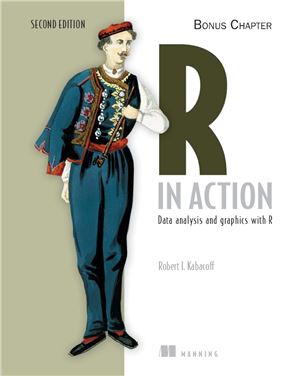
R in Action: Data Analysis and Graphics with R (Additional materials)
RAR

Using R for Data Analysis and Graphics: Introduction, Code and Commentary

Visualize This: The FlowingData Guide to Design, Visualization, and Statistics

R Data Visualization Cookbook

Теория пространственных точечных процессов в задачах экологии и природопользования (с применением пакета R)
RAR

Environmental Stats for S-Plus: User's Manual for Version 2.0

RMark: An R Interface for Analysis of Capture-Recapture Data with MARK
