Multivariate Humanities
Book information
Description
This case study-based textbook in multivariate analysis for advanced students in the humanities emphasizes descriptive, exploratory analyses of various types of data sets from a wide range of sub-disciplines, promoting the use of multivariate analysis and illustrating its wide applicability. Fields featured include, but are not limited to, historical agriculture, arts (music and painting), theology, and stylometrics (authorship issues). Most analyses are based on existing data, earlier analysed in published peer-reviewed papers. Four preliminary methodological and statistical chapters provide general technical background to the case studies. The multivariate statistical methods presented and illustrated include data inspection, several varieties of principal component analysis, correspondence analysis, multidimensional scaling, cluster analysis, regression analysis, discriminant analysis, and three-mode analysis. The bulk of the text is taken up by 14 case studies that lean heavily on graphical representations of statistical information such as biplots, using descriptive statistical techniques to support substantive conclusions. Each study features a description of the substantive background to the data, followed by discussion of appropriate multivariate techniques, and detailed results interpreted through graphical illustrations. Each study is concluded with a conceptual summary. Preface Global table of contents Contents Part I The Actors 1 Introduction: Multivariate studies in the Humanities 1.1 Preliminaries 1.1.1 Audience 1.1.2 Before you start 1.1.3 Multivariate analysis 1.1.4 Case studies: Quantification and statistical analysis 1.2 The humanities—What are they? 1.3 Qualitative and quantitative research in the humanities 1.4 Multivariate data analysis 1.5 Data: Formats and types 1.5.1 Data formats 1.5.2 Data characteristics: Measurement levels 1.5.3 Characteristics of data types 1.5.4 From one data format to another 1.6 General structure of the case study chapters 1.7 Author references 1.8 Wikipedia 1.9 Web addresses 2 Data inspection: The data are in. Now what? 2.1 Background 2.1.1 A researcher's nightmare 2.1.2 Getting the data right 2.2 Data inspection: Overview 2.2.1 The normal distribution 2.2.2 Distributions: Individual numeric variables 2.2.3 Inspecting several univariate distributions 2.2.4 Bivariate inspection 2.3 Missing data 2.3.1 Unintentionally missing 2.3.2 Systematically missing 2.3.3 Handling missing data 2.4 Outliers 2.4.1 Characteristics of outliers 2.4.2 Types of outliers 2.4.3 Detection of outliers 2.4.4 Handling outliers 2.5 Testing assumptions of statistical techniques 2.5.1 Null hypothesis testing 2.5.2 Model testing 2.6 Content summary 3 Statistical framework 3.1 Overview 3.2 Data formats 3.2.1 Matrices: The basic data format 3.2.2 Contingency tables 3.2.3 Correlations, covariances, similarities 3.2.4 Three-way arrays: Several matrices 3.2.5 Meaning of numbers in a matrix 3.3 Chapter example 3.4 Designs, statistical models, and techniques 3.4.1 Data design 3.4.2 Model 3.5 From questions to statistical techniques 3.5.1 Dependence designs versus internal structure designs 3.5.2 Analysing variables, objects, or both 3.6 Dependence designs: General linear model—glm 3.6.1 The t test 3.6.2 Analysis of variance—anova 3.6.3 Multiple regression analysis—mra 3.6.4 Discriminant analysis 3.6.5 Logistic regression 3.6.6 Advanced analysis of variance models 3.6.7 Nonlinear multivariate analysis 3.7 Internal structure designs: General description 3.8 Internal structure designs: Variables 3.8.1 Principal component analysis—pca 3.8.2 Categorical principal component analysis—CatPCA 3.8.3 Factor analysis—fa 3.8.4 Structural equation modelling—sem 3.8.5 Loglinear models 3.9 Internal structure designs: Objects, individuals, cases, etc. 3.9.1 Similarities and dissimilarities 3.9.2 Multidimensional scaling—mds 3.9.3 Cluster analysis 3.10 Internal structure designs: Objects and variables 3.10.1 Correspondence analysis: Analysis of tables 3.10.2 Multiple correspondence analysis 3.10.3 Principal component analysis for binary variables 3.11 Internal structure designs: Three-way models 3.11.1 Three-mode principal component analysis—tmpca 3.12 Hypothesis testing versus descriptive analysis 3.13 Model selection 3.14 Model evaluation 3.15 Designing tables and graphs 3.15.1 How to improve a table 3.15.2 Example of table rearrangement: a binary dataset 3.15.3 Examples of table rearrangement: contingency tables 3.15.4 How to improve graphs 3.16 Software 3.17 Overview of statistics in the case studies 4 Statistical framework extended 4.1 Contents and Keywords 4.2 Introduction 4.3 Analysis of variance designs 4.4 Binning 4.5 Biplots 4.6 Centroids 4.7 Contingency tables 4.8 Convex hulls 4.9 Deviance plots 4.10 Discriminant analysis 4.11 Distances 4.12 Inner products and projection 4.13 Joint biplots 4.14 Means plot with error bars, line graph, interaction plot 4.15 Missing rows and columns 4.16 Multiple regression 4.17 Multivariate, multiple, multigroup, multiset, and multiway 4.18 Quantification, optimal scaling, and measurement levels 4.19 Robustness 4.20 Scaling coordinates 4.21 Singular value decomposition 4.22 Structural equation modelling—sem 4.23 Supplementary points and variables 4.24 Three-mode principal component analysis (tmpca) 4.25 X2 test (χ2 test) Part II The Scenes 5 Similarity data: Bible translations 5.1 Background 5.2 Research questions: Similarity of translations 5.3 Data: English and German Bible translations 5.4 Analysis methods 5.4.1 Characteristics of multidimensional scaling and cluster analysis 5.4.2 Multidimensional scaling 5.4.3 Cluster analysis 5.5 Bible translations: Statistical analysis 5.5.1 Multidimensional scaling 5.5.2 Cluster analysis 5.6 Other approaches to analysing similarities 5.7 Content summary 6 Stylometry: Authorship of the Pauline Epistles 6.1 Background 6.2 Research questions: Authorship 6.3 Data: Word frequencies in Pauline Epistles 6.4 Analysis methods 6.4.1 Choice of analysis method 6.4.2 Using correspondence analysis 6.5 The Pauline Epistles: Statistical analysis 6.5.1 Inspecting Epistle profiles 6.5.2 Inertia and dimensional fit 6.5.3 Plotting the results 6.5.4 Plotting the Epistles profiles 6.5.5 Epistles and Word categories: Biplot 6.5.6 Methodological summary 6.6 Other approaches to authorship studies 6.7 Content summary 7 Economic history: Agricultural development on Java 7.1 Background 7.2 Research questions: Historical agricultural data 7.3 Data: Agriculture development on Java 7.4 Analysis methods 7.4.1 Choice of analysis method 7.4.2 catpca: Characteristics of the method 7.5 Agricultural development on Java: Statistical analysis 7.5.1 Categorical principal component analysis in a miniature example 7.5.2 Main analysis 7.5.3 Agricultural history of Java: Further methodological remarks 7.6 Other approaches to historical data: 7.7 Content summary 8 Seriation: Graves in the Münsingen-Rain burial site 8.1 Background 8.2 Research questions: A time line for graves 8.3 Data: Grave contents 8.4 Analysis methods 8.5 Münsingen-Rain graves: Statistical analysis 8.5.1 Fashion as an ordering principle 8.5.2 Seriation 8.5.3 Validation of seriation 8.5.4 Other techniques 8.6 Other approaches to seriation 8.7 Content summary 9 Complex response data: Evaluating Marian art 9.1 Background 9.2 Research questions: Appreciation of Marian art 9.3 Data: Appreciation of Marian art across styles and contents 9.4 Analysis method 9.5 Marian art: Statistical analysis 9.5.1 Basic data inspection 9.5.2 A miniature example 9.5.3 Evaluating differences in means 9.5.4 Examining consistency of relations between the response variables 9.5.5 Principal component analyses: All painting categories 9.5.6 Principal component analysis: Per painting category 9.5.7 Scale analysis: Cronbach's alpha 9.5.8 Structure of the questionnaire 9.6 Other approaches to complex response data 9.7 Content summary 10 Rating scales: Craquelure and pictorial stylometry 10.1 Background 10.2 Research questions: Linking craquelure, paintings, and judges 10.3 Data: Craquelure of European paintings 10.4 Analysis methods 10.5 Craquelure: Statistical analysis 10.5.1 Art-historical categories: Scale means 10.5.2 Scales, judges, and paintings: Three-mode component analysis 10.5.3 Separation of art-historical categories 10.6 Other approaches to pictorial stylometry 10.7 Content summary 11 Pictorial similarity: Rock art images across the world 11.1 Background 11.2 Research questions: Evaluating Rock Art 11.2.1 The Kimberley versus Algerian images 11.2.2 The Zimbabwean, Indian, and Algerian images 11.2.3 The Kimberley, Arnhem Land, and Pilbara images 11.2.4 General considerations 11.3 Data: Characteristics of Barry's rock art images 11.4 Analysis methods 11.4.1 Comparison of proportions 11.4.2 Principal component analyses for binary variables 11.5 Rock art: Statistical analysis 11.5.1 Comparing rock art from Algeria and from the Kimberley 11.5.2 Comparing rock art from Zimbabwe, India, and Algeria 11.5.3 Comparing rock art images from within Australia 11.5.4 Further analytical considerations 11.6 Other approaches to analysing rock art images 11.7 Content summary 12 Questionnaires: Public views on deaccessioning 12.1 Background 12.2 Research questions: Public views on deaccessioning 12.3 Data: Public views about deaccessioning 12.3.1 Questionnaire respondents 12.3.2 Questionnaire structure 12.3.3 Type of data design 12.4 Analysis methods 12.5 Public views on deaccessioning: Statistical analysis 12.5.1 Item distributions 12.5.2 Item means 12.5.3 Item correlations 12.5.4 Measurement models: Preliminaries 12.5.5 Measurement models: Confirmatory factor analysis 12.5.6 Measurement models: Deaccessioning data 12.5.7 Item loadings 12.5.8 Interpretation 12.6 Other approaches in deaccessioning studies 12.7 Content summary 13 Stylometry: The Royal Book of Oz - Baum or Thompson? 13.1 Background 13.2 Research questions: Competitive authorship 13.3 Data: Occurrence of function words 13.3.1 Preprocessing 13.3.2 Dataset 13.4 Analysis methods 13.4.1 Significance testing 13.4.2 Distributions and graphics 13.4.3 Principal component analysis and graphics 13.4.4 Cluster analysis 13.5 Wizard of Oz: Statistical analyses 13.5.1 Principal component analysis 13.5.2 Cluster analysis 13.6 Other approaches in authorship studies 13.7 Content summary 14 Linguistics: Accentual prose rhythm in mediæval Latin 14.1 Background 14.2 Research questions: Accentual prose rhythm in mediæval Latin 14.3 Data: Janson's data tables 14.4 Analysis methods 14.4.1 Contingency tables 14.4.2 Ordinal principal component analysis 14.5 Accentual prose rhythm: Statistical analysis 14.5.1 Internal structure of individual authors' cadences 14.5.2 Similarities in accentual prose rhythm 14.6 Content summary 15 Linguistics: Chronology of Plato's works 15.1 Background 15.2 Research questions: Plato's chronology 15.3 Data: Kaluscha's clausulae data 15.4 Analysis methods 15.5 Plato's chronology: Statistical analysis 15.5.1 Text similarities 15.5.2 Clausulae and texts 15.6 Other approaches to Plato's chronology 15.7 Content summary 16 Binary judgments: Reading preferences 16.1 Background 16.2 Research questions: Binary variables 16.3 Data: Reading preferences 16.4 Analysis methods 16.4.1 Loglinear modelling 16.4.2 Multiple correspondence analysis 16.4.3 Supplementary variables 16.5 Reading preferences: Statistical analysis 16.5.1 Co-occurrence of quality and popular reading 16.5.2 Complexity of the relations 16.5.3 Multiple correspondence analysis 16.5.4 Supplementary background variables 16.6 Other approaches to binary judgments 16.7 Content summary 17 Music appreciation: The Chopin Preludes 17.1 Background 17.2 Research questions: Appreciation and musical knowledge 17.3 Data: Semantic differential scales 17.3.1 Musical database: Semantic differential scales 17.3.2 Design and data collection 17.3.3 Data format: Students, Preludes, and Scales 17.4 Analysis methods 17.4.1 Two-way multivariate analysis of variance 17.4.2 Tucker's three-mode model 17.4.3 Joint biplots 17.5 The Chopin preludes: Statistical analysis 17.5.1 Individual differences 17.5.2 Three-mode principal component analysis—tmpca 17.5.3 Scale components 17.5.4 Prelude components 17.5.5 Joint biplot—Consensus 17.5.6 Preludes as characterised by the scales 17.5.7 Circle of fifths: Judgments and keys 17.5.8 Joint biplot—Individual differences 17.6 Other approaches to evaluating music appreciation 17.7 Content summary 18 Musical stylometry: Characterisation of music 18.1 Background 18.2 Research questions: Differences in musical style 18.3 Data: Melodic intervals and pitch 18.3.1 Musical database 18.3.2 Musical styles: Features 18.3.3 Design 18.4 Analysis methods 18.4.1 Binary logistic regression 18.4.2 Multinomial logistic regression 18.4.3 Discriminant analysis 18.5 Characterisation of music: Statistical analysis 18.5.1 Data description 18.5.2 Data inspection 18.5.3 Preliminaries for the analyses 18.5.4 Predicting Bach versus Haydn + Beethoven 18.5.5 Genre: Heterogeneity of the Bach pieces 18.5.6 Genre: Discriminating between Bach pieces 18.6 Other approaches to analysing musical styles: 18.7 Content summary Part III The Finale 19 Final Musings Appendix A Discipline-orientated statistics books Appendix Statistical Glossary Appendix References Index
Similar books

Multivariate Humanities
2021 · EPUB

Applied Multiway Data Analysis
2008 · DJVU
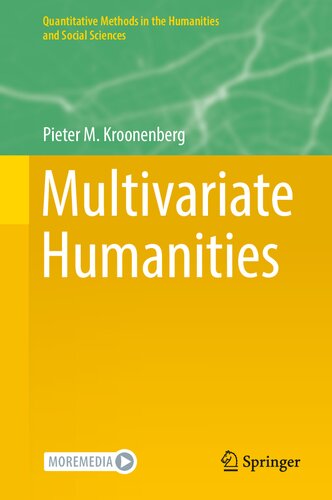
Multivariate Humanities (Quantitative Methods in the Humanities and Social Sciences)
2021 · PDF

Applied Multiway Data Analysis (Wiley Series in Probability and Statistics)
2008 · PDF

Applied Multiway Data Analysis
2008 · PDF

MySQL® Notes for Professionals book
2018 · PDF

MrExcel 2022: Boosting Excel
2022 · PDF

MrExcel 2022: Boosting Excel
2022 · PDF